About the TRIAGE Project
This project is a research dashboard that helps teams understand patterns of collaboration, conflict, and wellbeing over time. Surveys and Research feed into analytics and an AI assistant, Professor Truce, so that teams receive clear, psychology-informed feedback they can act on.
At a high level, the project works as follows. Team members fill out short, psychology-based surveys. Those responses are stored securely, analyzed in the background, and then shown on the dashboard as trends and visual summaries. When team members have questions about their results, they can ask Professor Truce—an AI assistant that uses the same underlying research to give structured, careful feedback rather than generic advice.
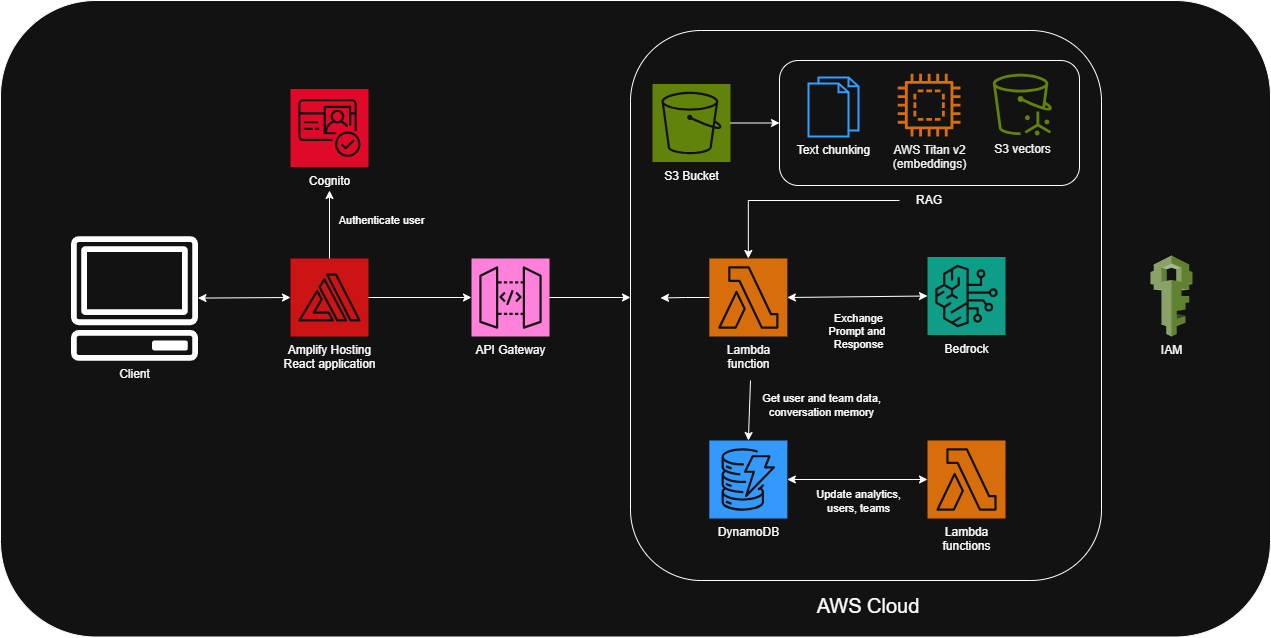
Starting from the bottom: think of DynamoDB as the place where survey answers and analytics data are stored. Just above that “database layer” is a cloud of Amazon services:
- Each Lambda function is a small piece of code that runs the moment a user does something—like submitting a survey, loading analytics, or talking to Professor Truce.
- For Professor Truce, one Lambda connects to Amazon Bedrock, which is how we access a carefully chosen AI model.
- IAM (Identity and Access Management) sits beside the cloud to manage who and what is allowed to access these services.
- Finally, Route 53 is like the project's address book, making sure that when users type in collaborithm.org, they get directed to the right place in AWS.
Moving further up, API Gateway acts like the “front door” that safely connects those backend services to the website. The site itself is hosted in AWS Amplify, which also uses S3 and CloudFront to store static files and deliver the dashboard quickly to users.
This project is implemented as a serverless, event-driven application on AWS:
- Frontend: deployed through AWS Amplify. Amplify handles CI/CD, environment management, and integration with Cognito/IAM-backed authentication.
- APIs: Amazon API Gateway exposes a set of REST endpoints for survey submission, analytics queries, and the Professor Truce chat interface.
- Compute: Multiple AWS Lambda functions written in Node.js and Python handle survey ingestion, aggregation jobs, and calls to Bedrock models.
- Data: Amazon DynamoDB is used as the primary data store for longitudinal survey responses, derived metrics, and cached analytics views.
- AI integration: The Professor Truce Lambda calls Amazon Bedrock with prompts that are constrained to our curated research corpus and survey schema, enabling grounded, reproducible responses.
- Delivery: Static assets are stored in Amazon S3 and served through Amazon CloudFront for low-latency, cached delivery to users.
From a user perspective, the main goals are simple: protect individual privacy and show results in a way that is useful for the whole team—not for monitoring any one person.
-
✓Encryption in transit & at rest Survey responses and dashboard data are encrypted when they move between your browser and AWS, and again when they are stored in DynamoDB and S3.
-
✓Role-based access Access is managed through AWS Identity and Access Management (IAM). Only authorized services and project staff can reach the underlying data, and each has only the minimum permissions needed.
-
✓Aggregation over individuals Dashboards are designed to focus on group-level patterns (e.g., conflict trends over time), not detailed profiles of specific people. Where possible, results are de-identified or aggregated.
-
✓Research-aligned responses Professor Truce is constrained to use vetted research articles and survey constructs instead of pulling in arbitrary internet content, so feedback is grounded in the same instruments participants completed.
In plain language: the system is built so that survey data is encrypted, access is limited, and the insights are presented in a way that supports healthy team discussion rather than surveillance.